Status TAT calculation allows you to observe how efficient your team is in addressing incoming posts and delivering a great experience to your customers. Your team can identify bottlenecks during a post lifecycle to improve processes and performance.
What questions does the TAT summary help you answer?
How much time a post has stayed in each status/state?
What is/are the slow-moving/ stagnant statuses?
-
What is the overall time the team takes to handle requests?
How to enable the feature?
Start by navigating to your Dashboard.
Choose Boards on the sidebar and then navigate to the Settings tab.
-
Scroll down to Additional Settings where you can enable the toggle for Status TAT Summary.
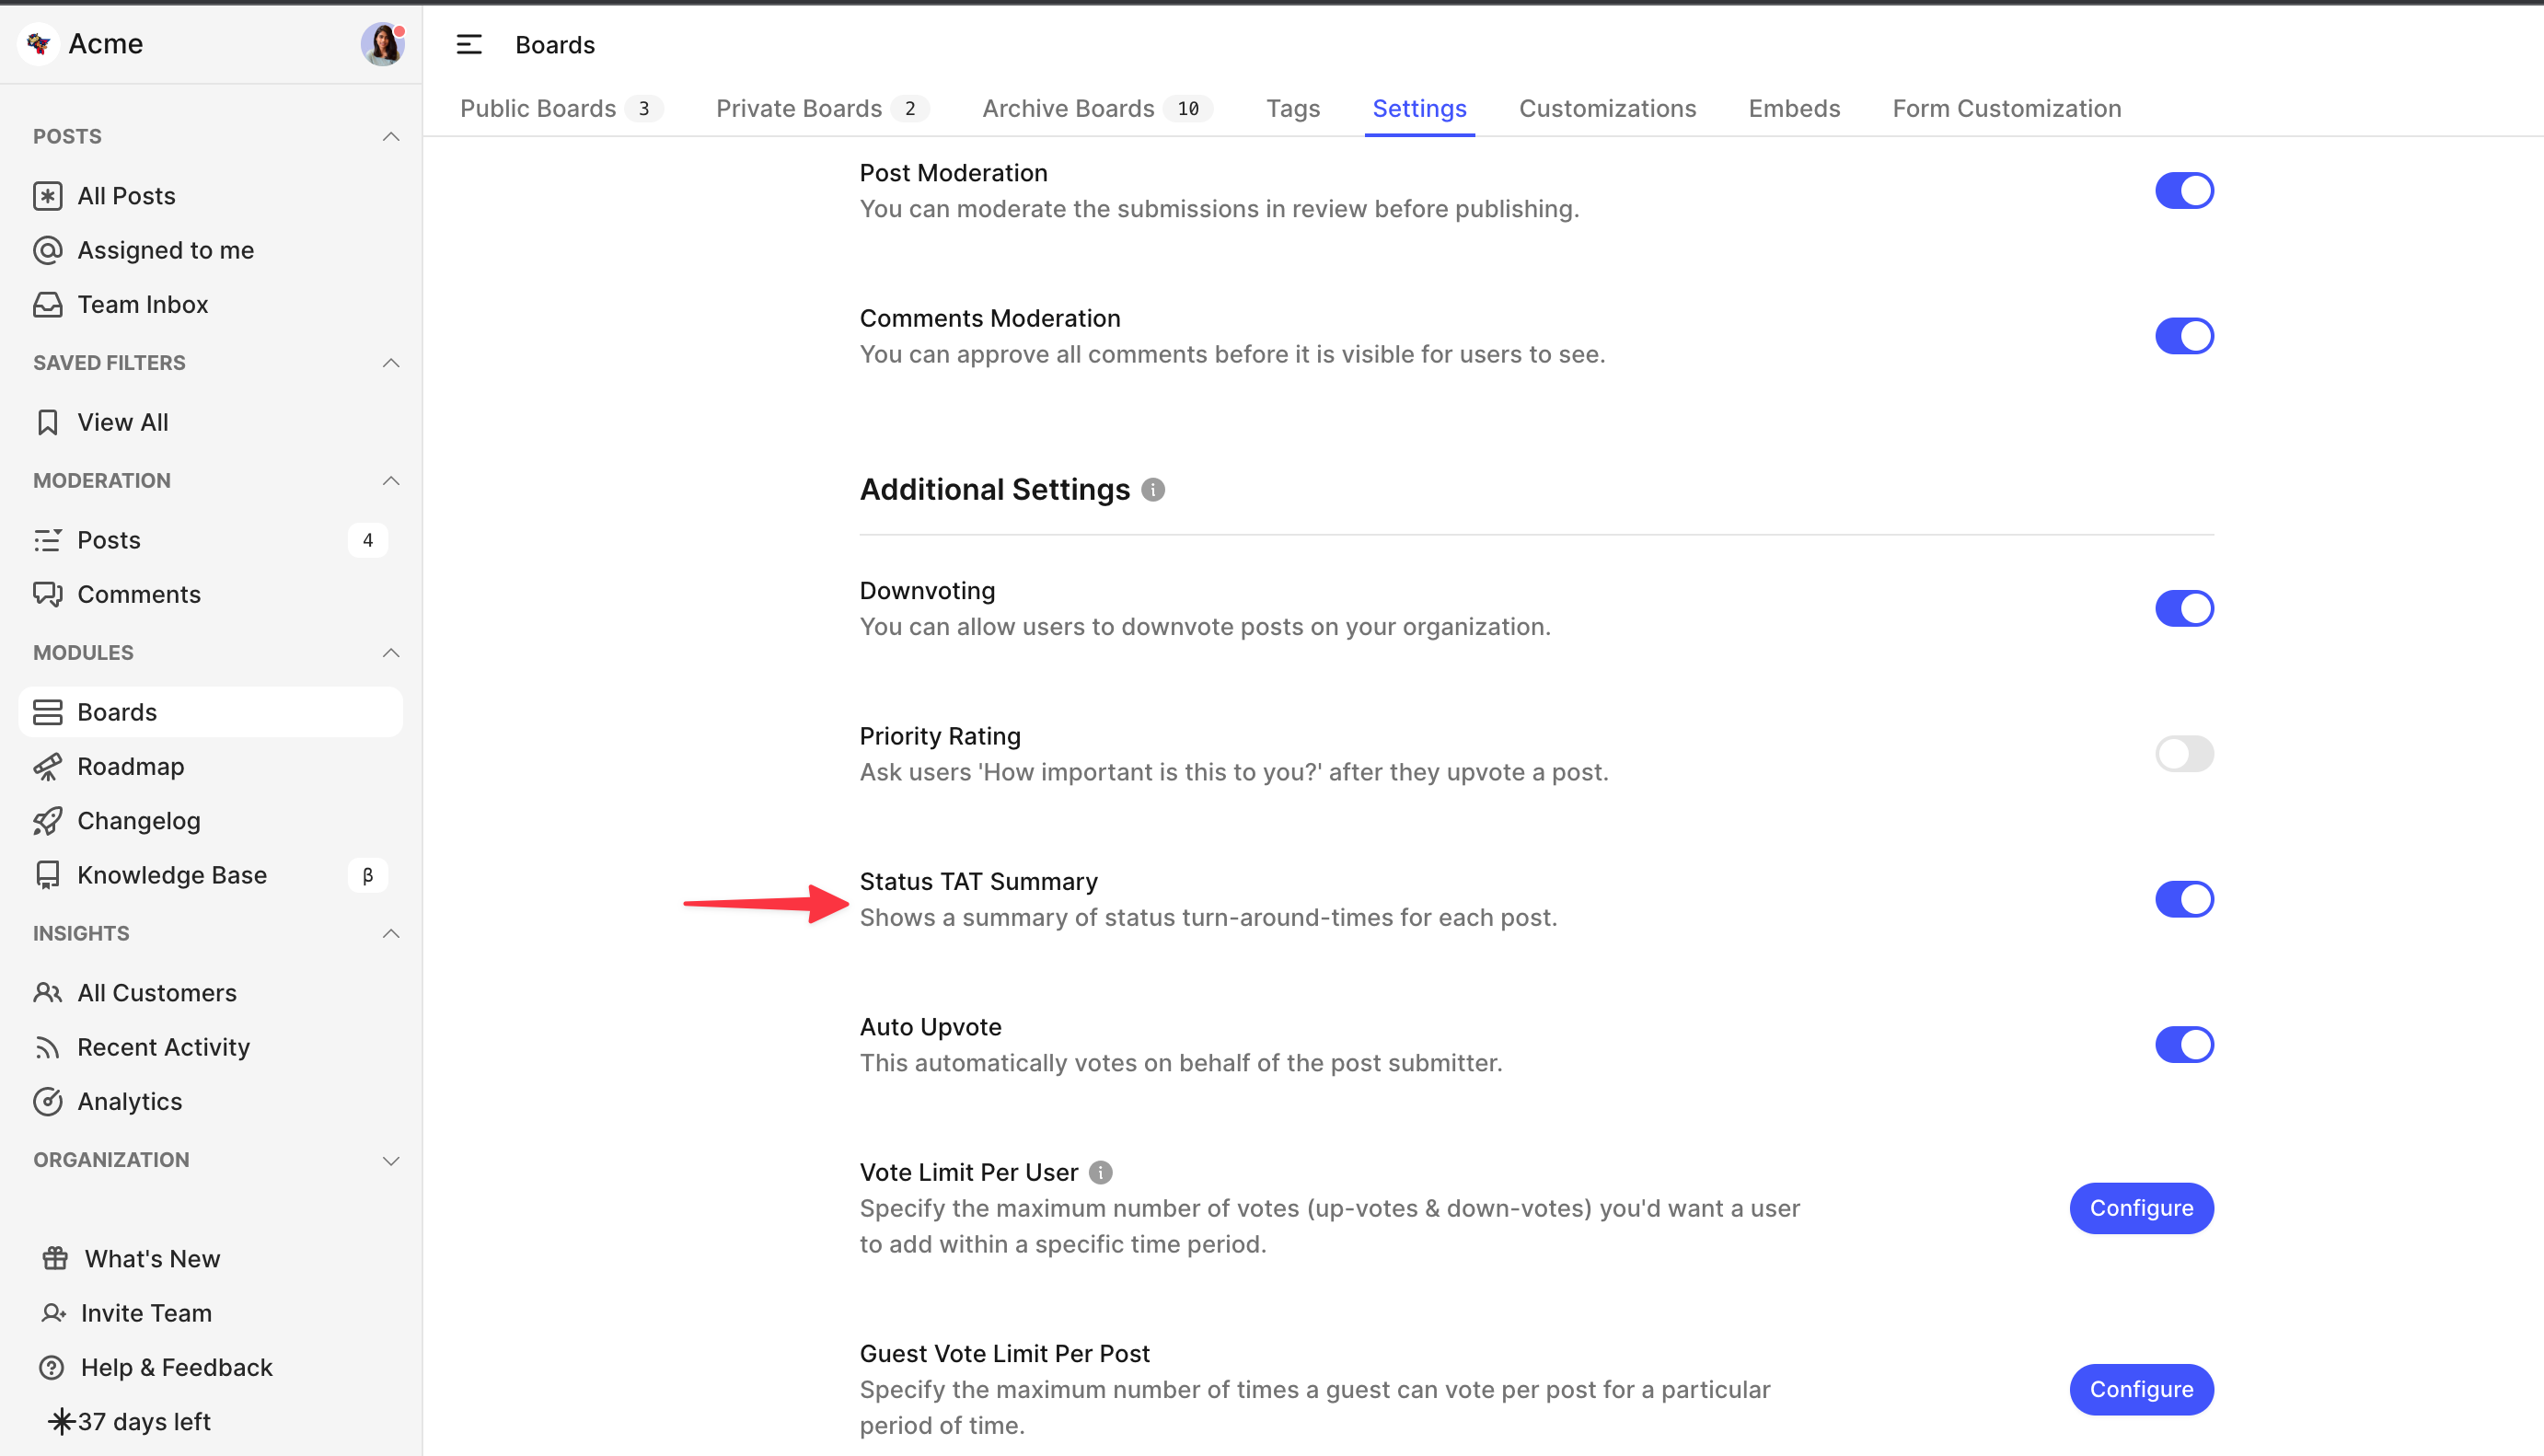
Please note that only status changes that occur on or after December 13th 2022 (the date this feature was released) will be recorded.
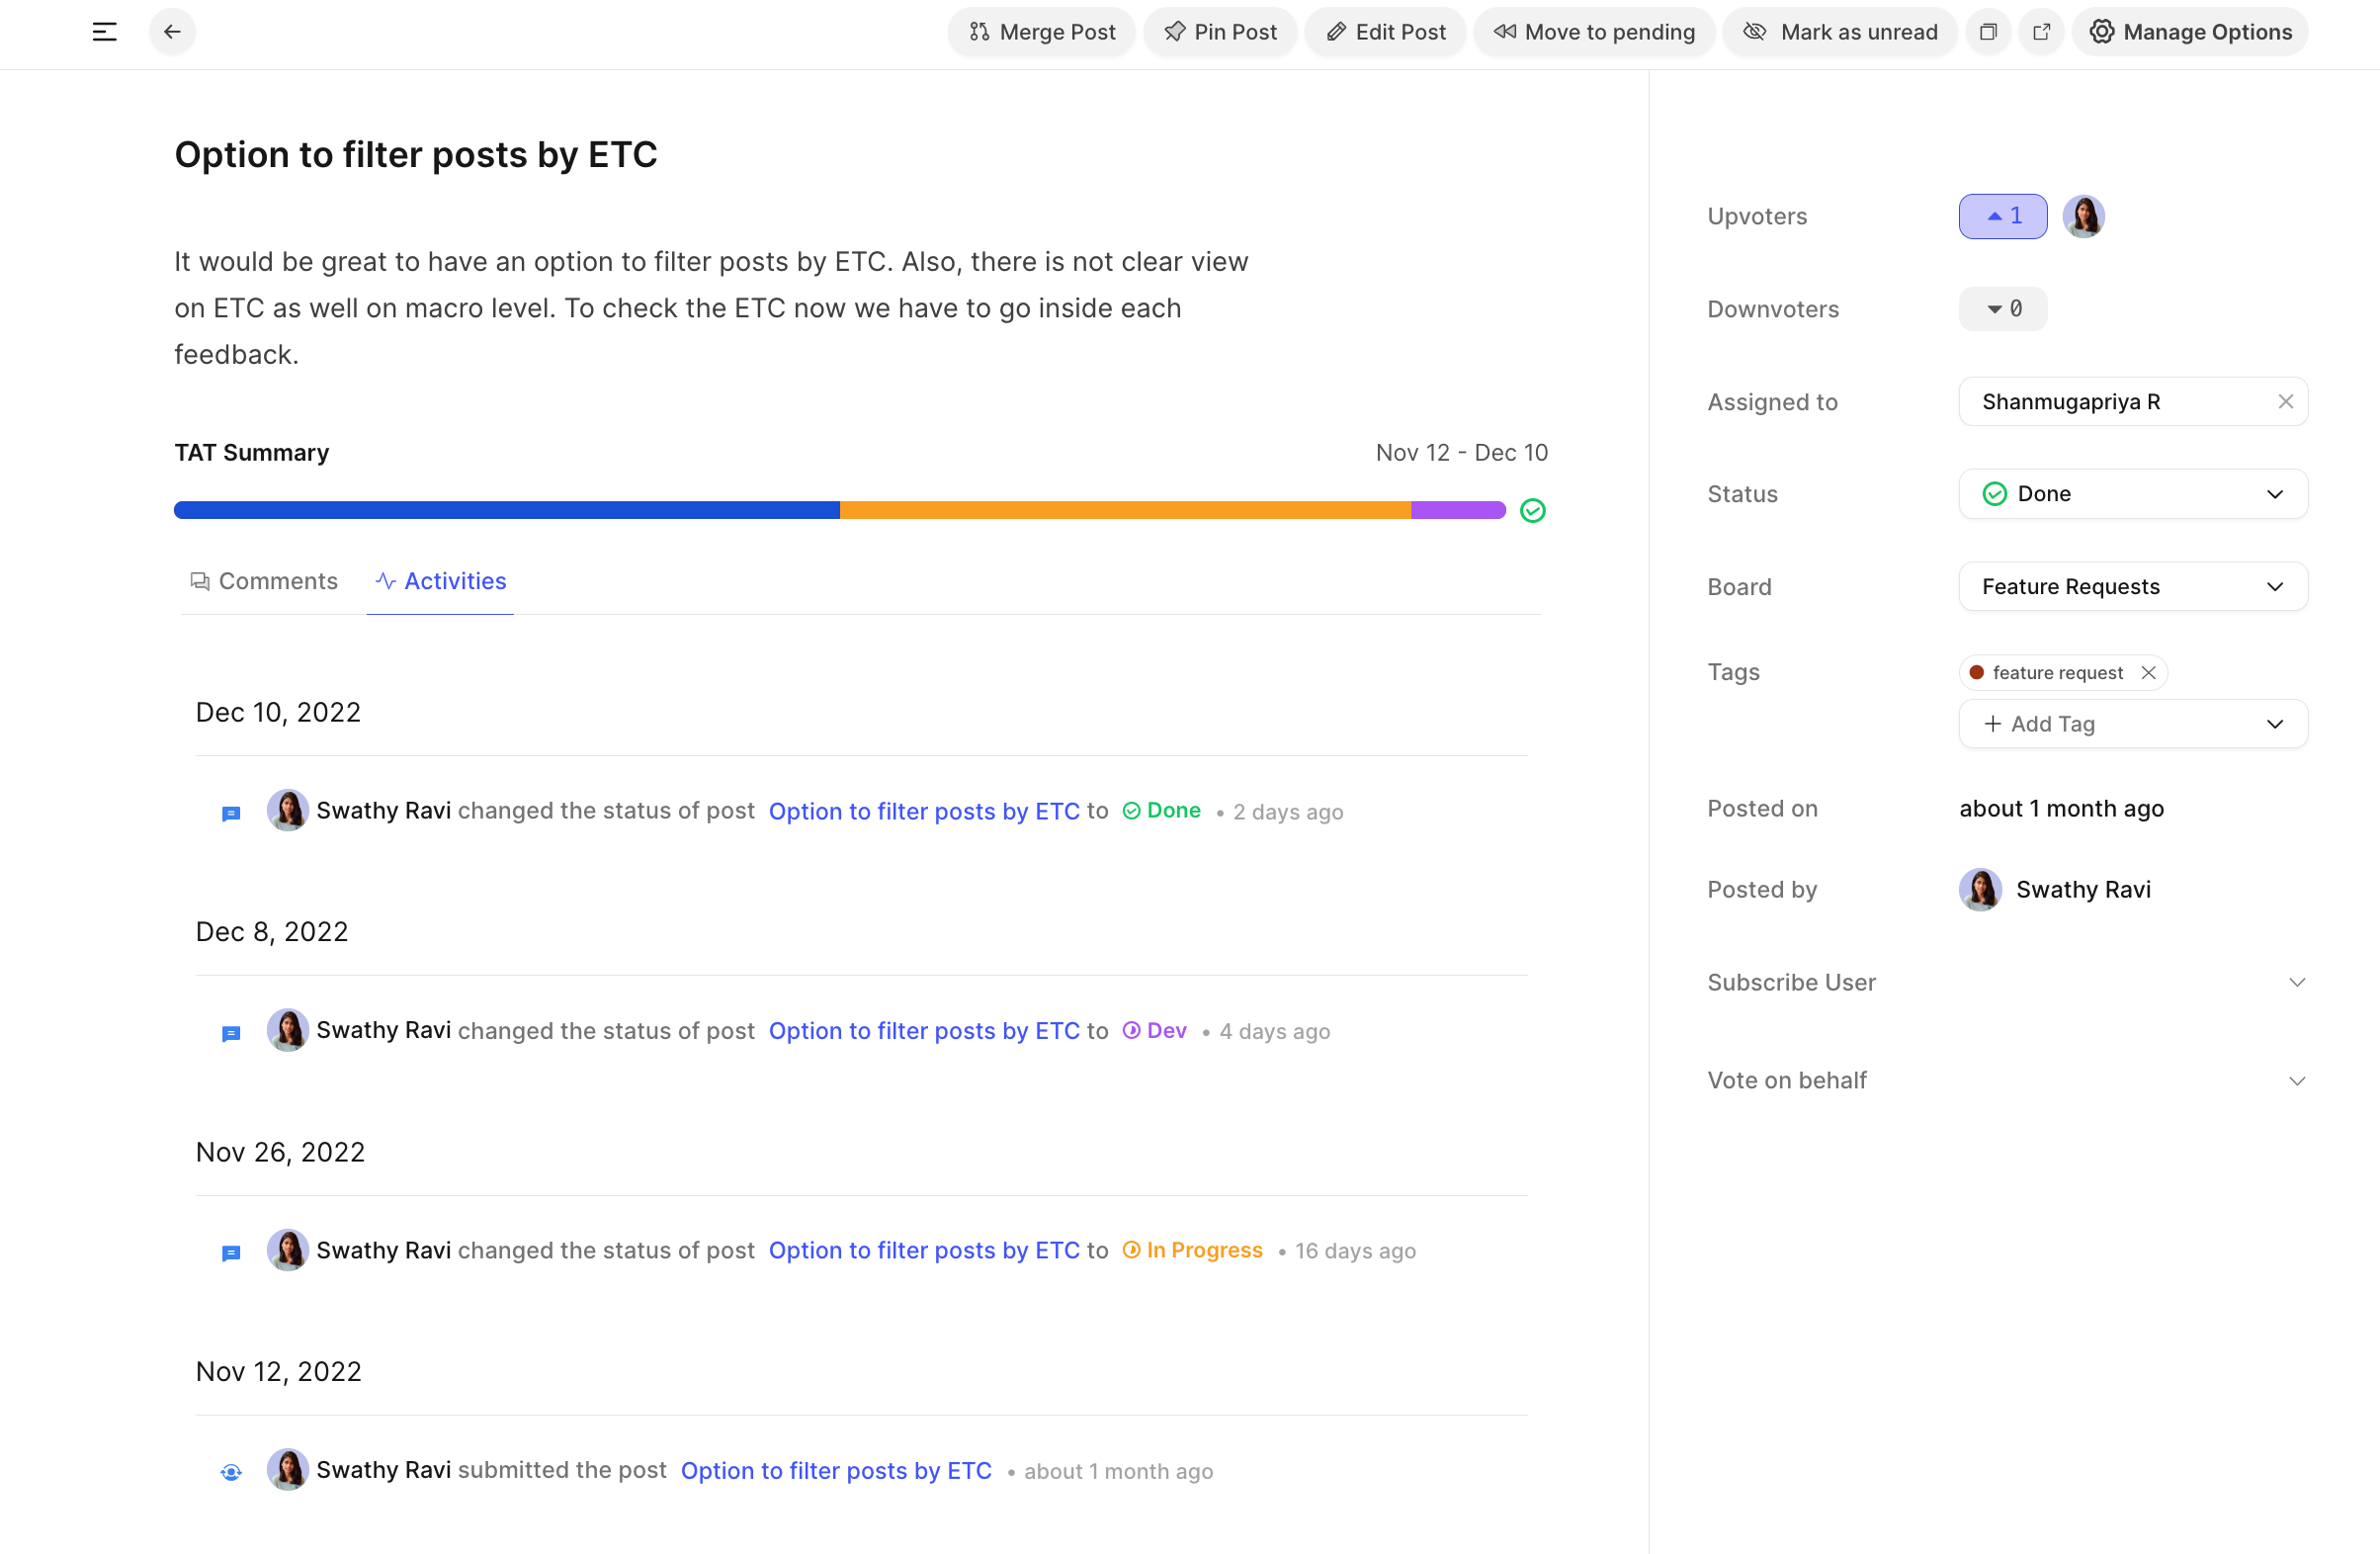
How TAT is calculated for a single post?
The TAT summary graph for a single post maps the path the post takes along the statuses you have set, as you make the changes. This calculation starts at the time the post is created and ends when the post moves to one of what we call “End Statuses” - Completed or Closed.
This includes the custom states that you may have configured under each status, including Completed and Closed. It also shows you the total active duration of a post!
 The graph shows you the status in which the post has stayed the longest in. With this data handy you can simply focus on reducing the wait time of the posts and arrive at zero dormant posts!'
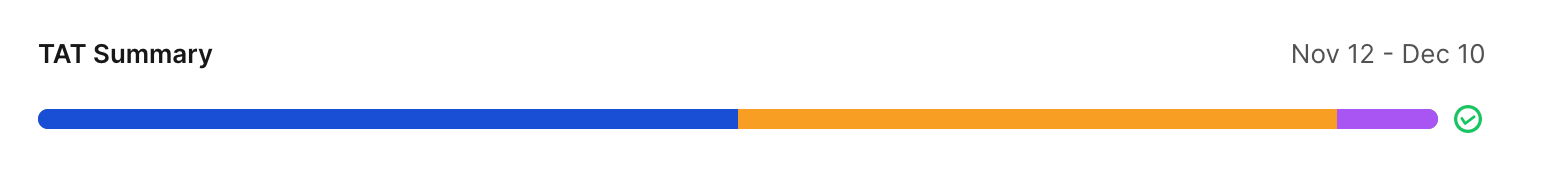
Here’s an example!
For a post with the status movement over a period of November 12 to December 10, the status TAT summary will cover all the below status movements.
Here’s a quick view of how the graph will be for the post above.
How TAT is calculated for Analytics?
The Analytics Dashboard has the option to choose the time range, to see the graph for status TAT summary and other metrics - Today, Last 7 Days, Last 30 Days, This Month, This Year and Last Month.
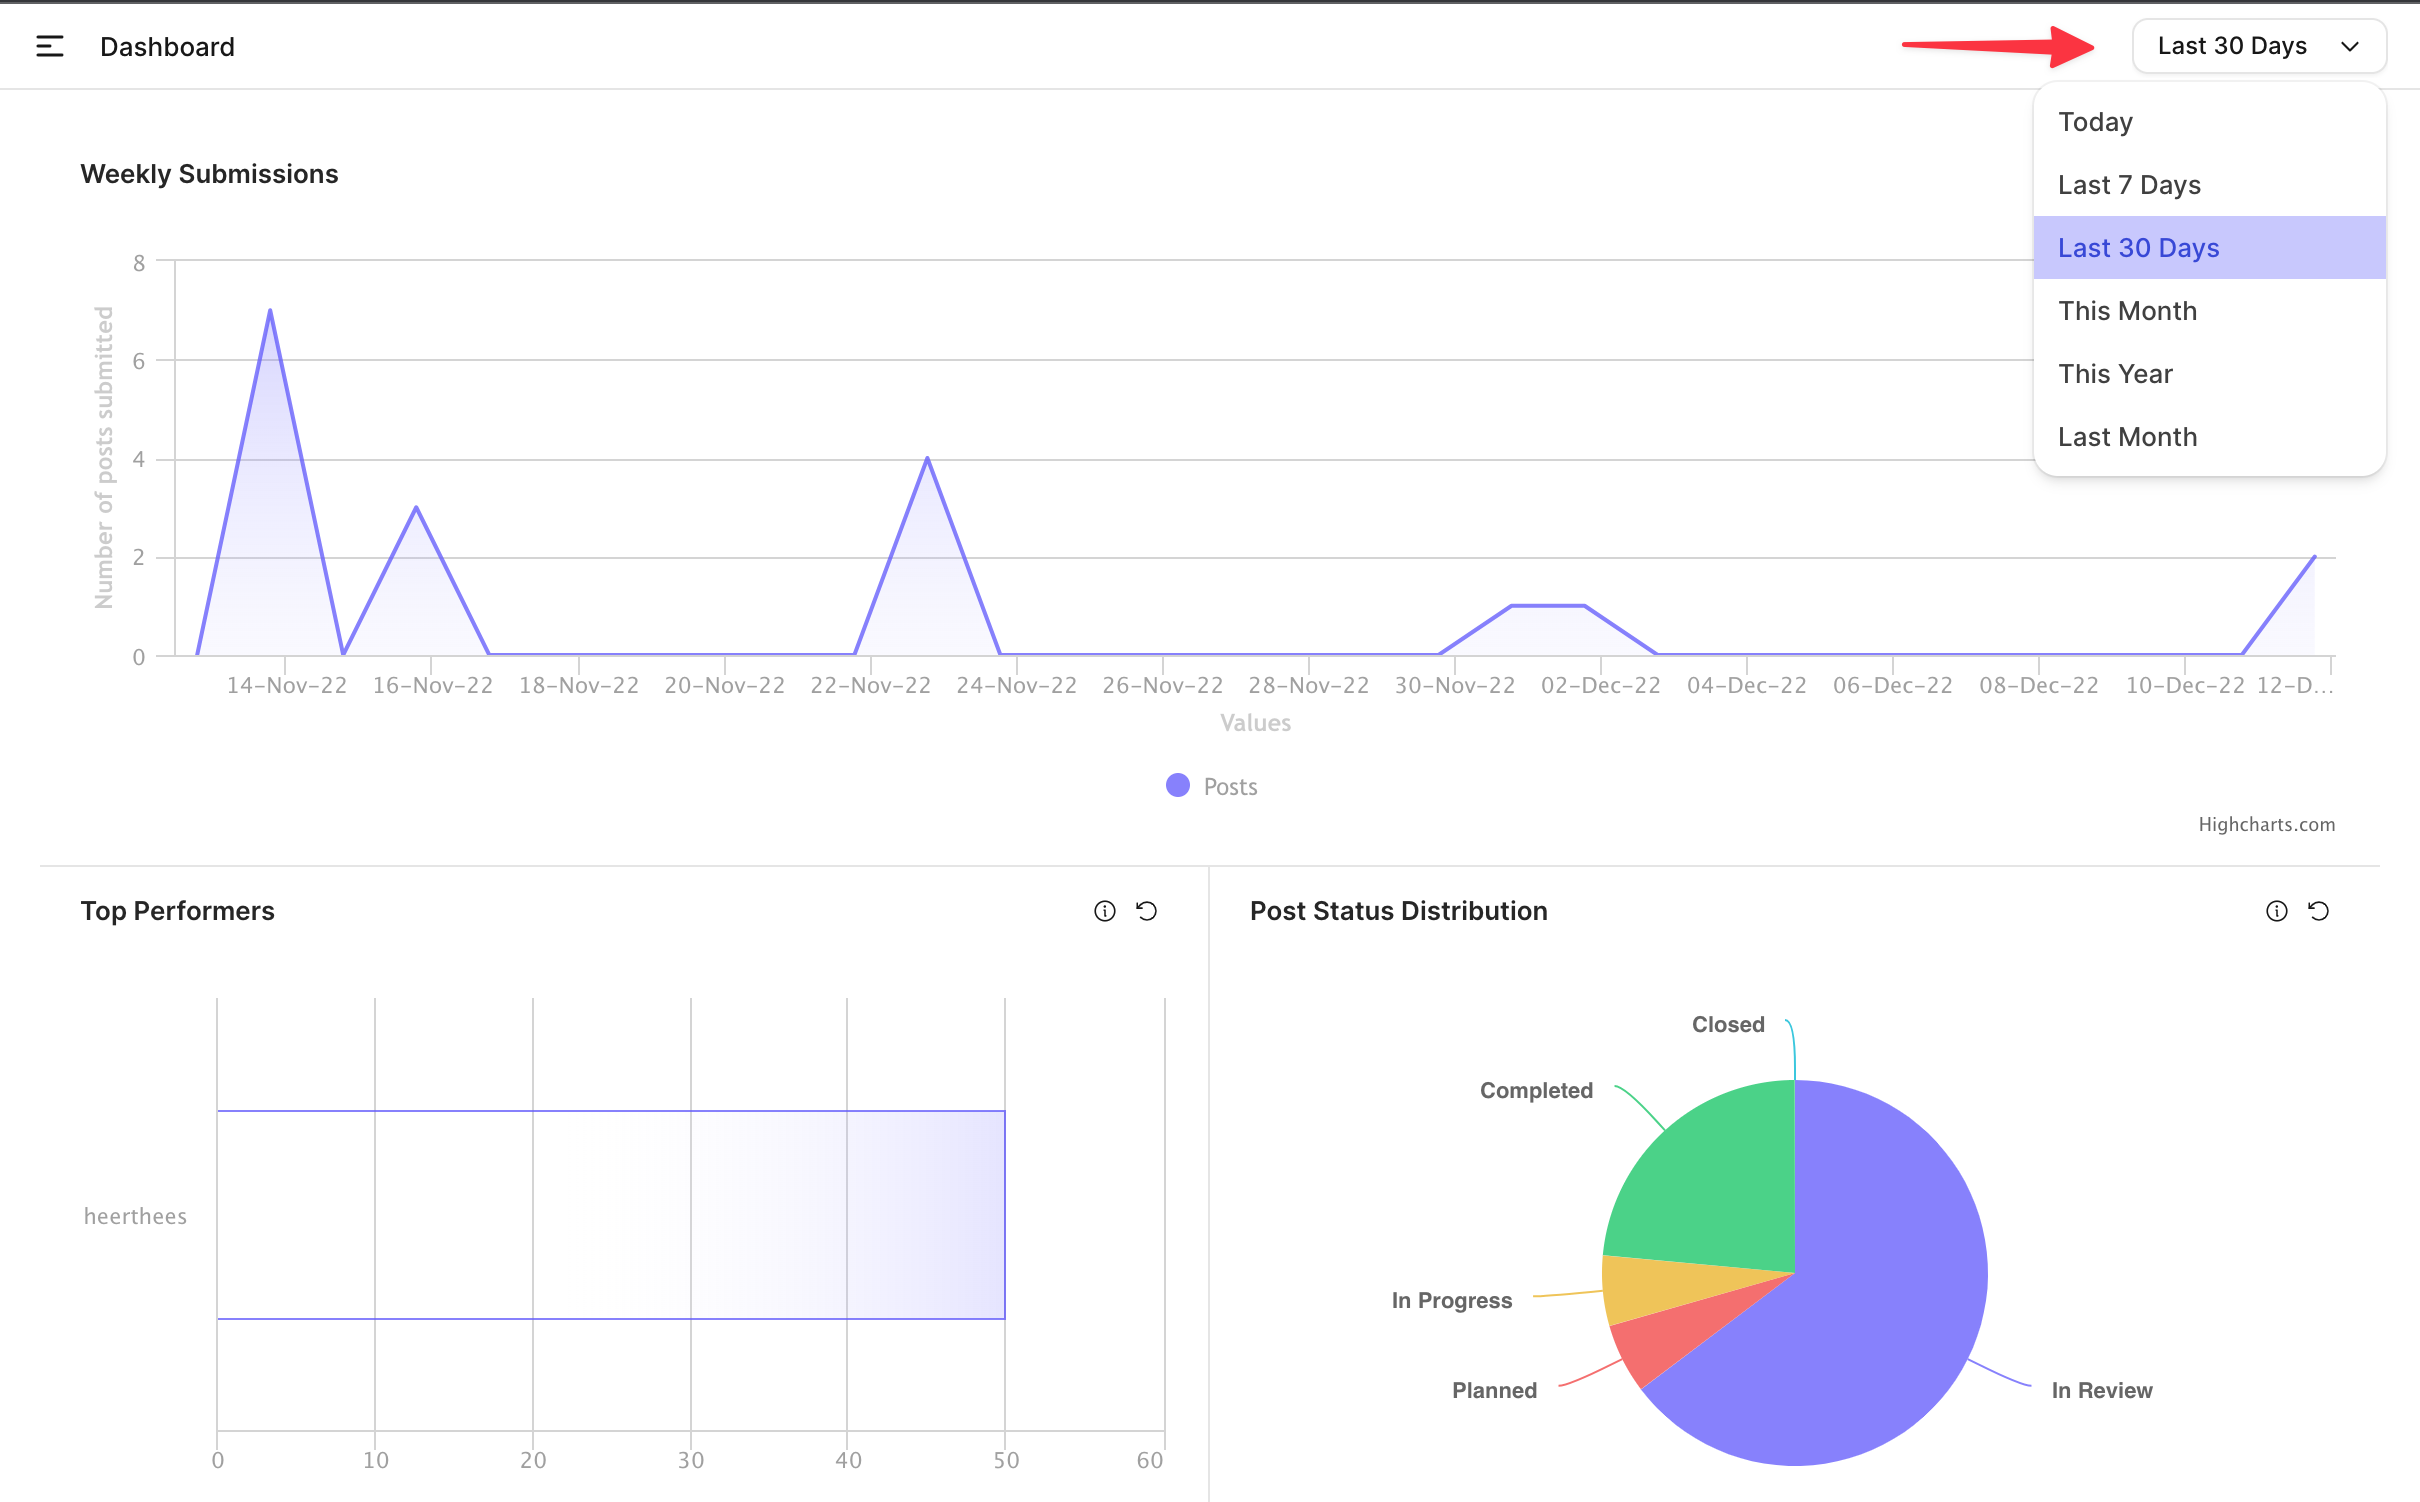 So, for every feature that stays in a given status, in the selected timeframe we calculate the average time of all such features spent in the status.
Dashboard Analytics is only available on Take Flight or higher plans (or) if you have purchased the module as a Power-up! Interested to purchase Dashboard Analytics? Leave us a message! 😃
Head to your dashboard now to enable status TAT summary and start tracking your posts’ lifecycle effectively.
Do feel free to reach out to us should any queries arise! 😄